Multi MA Trend Following Strategy TemplateTrend following is one of the better known technical trading strategies. But, which trend should you follow? Today I am sharing with the community a trend following template script that includes a selection of over 20 different trends / regressions. Some of these are in the Pine library, and some have been custom coded and contributed over time by the beloved Pine Coder community.
How it works:
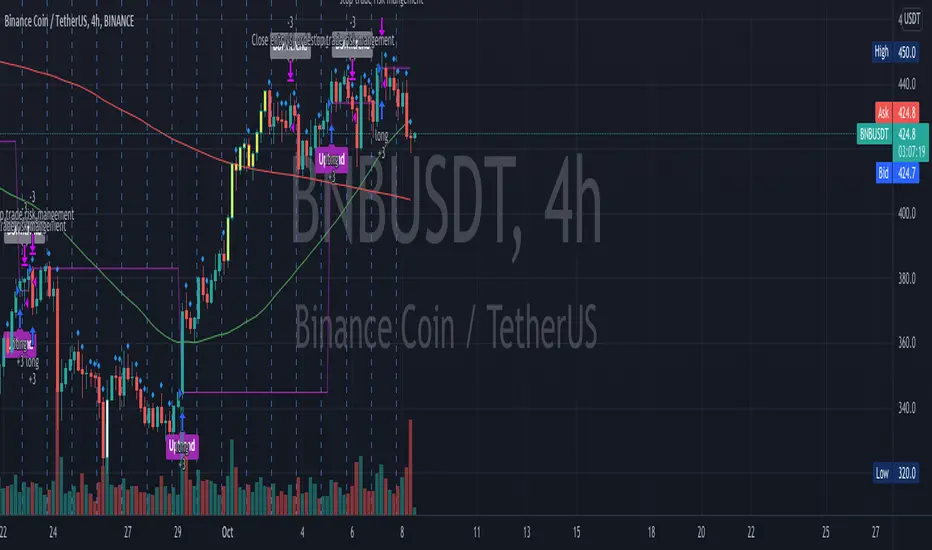
This template will plot any of the 20+ trends that you can select in the settings. The strategy component will buy if the trend line is moving up, and will sell if it moves down. If the line is green that indicates that the trend is higher than the prior bar. If the line is red that indicates that the trend is lower than the prior bar. This script is different from many moving average scripts in that it follows the trend itself and doesn't look for a cross of multiple trends.
How to use it:
When wanting to trend follow an instrument, you can use this template to help identify what approach you might want to take and/or which indicator you might want to use. You can also modify the strategy as you see fit and make use of the 20+ incorporated indicators. Incorporate your trade and risk management strategy, or use it as an indicator.
Disclaimer: Open source scripts I publish in the community are largely meant to spark ideas that can be used as building blocks for part of a more robust trade management strategy. Even though this example script might beat buy and hold over the back-test time-frame, I wouldn't advise using it as a stand-alone strategy without significant additions/modifications to the strategy and risk management functions.
Cari dalam skrip untuk "the strat"

3Commas DCA Backtester + TBO3Commas DCA bot users rejoice! Have you ever wanted to know how your 3Commas DCA bot would have performed with slightly different settings? Or a different deal start condition? Another safety trade? We've combined the logic of 3Commas DCA Bots with TradingView's powerful strategy backtester to FINALLY help 3Commas users backtest their bot settings.
There are several things to be aware of with this strategy:
There is no bot assistant in TradingView, so you'll have to enter in your funds for bot trading in the "Initial capital" section in the Properties tab of the settings.
Even though you can use simultaneous deals with this strategy, there is no way on TradingView to collectively backtest multiple trading pairs with a single instance of this strategy.
We have created all of the available deal start conditions natively available in 3Commas DCA Bots PLUS the TBO and its trigger symbols (Open Long, Close Long, Cross Up, Breakout, Open Short, Close Short, Cross Down, Breakdown). The strategy uses ASAP (as soon as possible) by default.
3Commas DCA Bots use a built-in AND logic for the deal start conditions, meaning that deals will only start when ALL deal start conditions are true. This logic is included in the strategy, however we also provided the option to use OR logic, which will trigger a deal if any of the selected deal start conditions have been met.
Use your own indicators by selecting the "external" option under deal start conditions.
Cooldown between deals cannot use seconds as this is a limitation in TradingView (the strategy will only run on the current timeframe you are viewing), so this has been changed to "next bar."
Customize your backtests in our look back section. Select a specific start and end date for your back test results.
Use the strategy to send alerts directly to your 3Commas bots by providing your bot ID numbers and your email token (found in the JSON code when viewing your bot's overall settings).
Some things to keep in mind while using the back tester:
Enable Buy & Hold Equity to compare your bot strategy and settings.
The back tester can't guarantee future results based on past performance.
Stop losses will result in poor performance. Take advantage of DCA strategy and use safety trades.
Settings for the strategy shown are:
Bot type: Long
Take Profit type: % Quote
Base order: 25
Safety order: 50
Deal Start Conditions:
Custom - OR
TBO Breakout
15m Strong Buy
1h Strong Buy
4h Strong Buy
Target Profit: 4
Max Active Safety Trades: 2
Price deviation in %: 8
Safety order volume scale: 2
Safety order step scale: 2
Simultaneous deals per same pair: 3
Lookback:
2020-05-11
9999-01-01

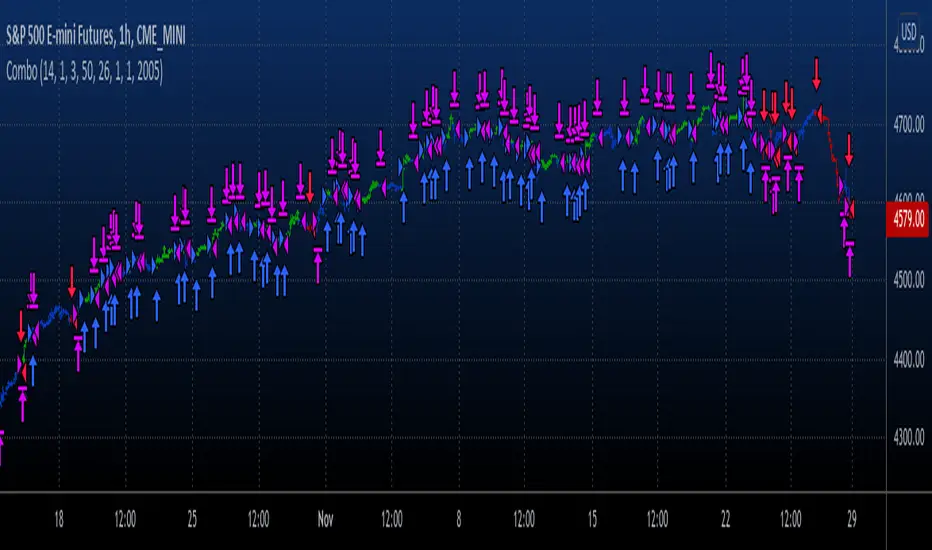
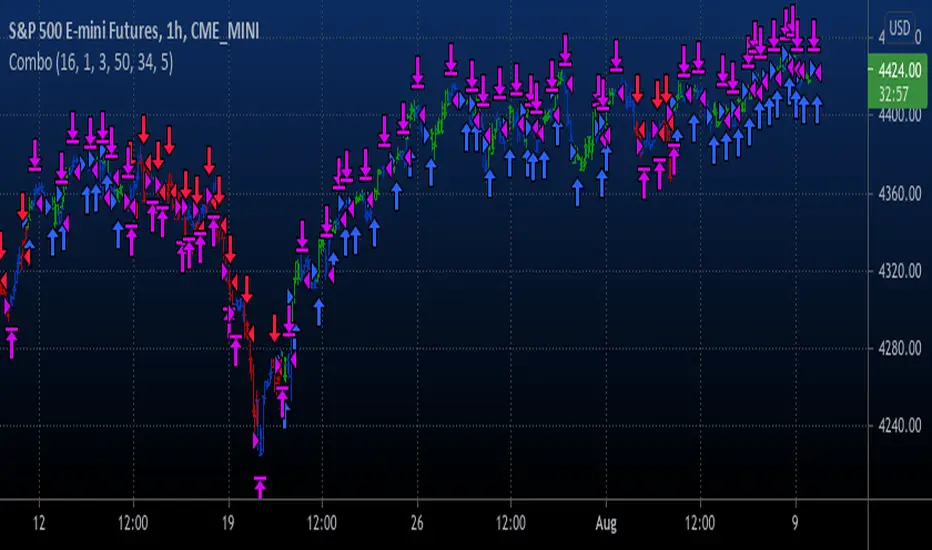
Combo Backtest 123 Reversal & TEMA1This is combo strategies for get a cumulative signal.
First strategy
This System was created from the Book "How I Tripled My Money In The
Futures Market" by Ulf Jensen, Page 183. This is reverse type of strategies.
The strategy buys at market, if close price is higher than the previous close
during 2 days and the meaning of 9-days Stochastic Slow Oscillator is lower than 50.
The strategy sells at market, if close price is lower than the previous close price
during 2 days and the meaning of 9-days Stochastic Fast Oscillator is higher than 50.
Second strategy
This study plots the TEMA1 indicator. TEMA1 ia s triple MA (Moving Average),
and is calculated as 3*MA - (3*MA(MA)) + (MA(MA(MA)))
WARNING:
- For purpose educate only
- This script to change bars colors.
TradingGroundhog - Strategy & Fractal V1#-- Public Strategy - No Repaint - Fractals -- Short term
Here I come with another script, more simple than Wavetrend V1. You will love it.
#-- Synopsis --
Another simple idea, on a small time frame (15 min) we buy when the opening price goes below a Bottom fractals and sell when it goes over a Top fractals, but as this script do not use Wavetrends. You should stop by your self to use the script during long lasting downtrends.
I developed the strategy using BTC /EUR 3 MIN BINANCE but it can be applied to many other cryptos, I don't know for forex or others. You can use it for short term (to a month of uptrend) and automated trading.
#-- Graph reading --
And now, how to read it ?
Fractals:
Yellow Flags occur when the opening price goes below a Bottom fractal , it means Buy.
White Flags appear when the opening price goes over a Top fractal , it means Sell.
#-- Parameters --
*** Parameters have been intensively optimized using 10 cryptocurrency markets in order to have potent efficiency for each of them. I would recommend to only change the Can Be touch parameter. For the others, I don't recommend any modifications. The idea behind the script is to be able to switch between markets without having to optimize parameters, less work, easy to target active crypto and therefor limit the risks. ***
Can be touch :
'Filter fractals' : Activate or Disable the filtering fractal operation. If Enable, buy during less risky periods. (Activate is often better)
Can be touch but not necessary :
'VolumeMA' : The Volume corrector used by the fractals
'Extreme window' : The number of price individuals to look for if we want to remove extreme fractals.
Not to touch :
'Long Sop Loss (%)' : The minimal difference of price between a Fractal bottom and the opening price to buy.
#-- Time frame --
Should be used with the following time frames depending on the necessity:
1 MIN
3 MIN (Preferred with the parameters set)
5 MIN
#-- Last words --
The script can be set up to send Tradingview signals to 3comma just by adding comment = " " in strategy.close_all() and strategy.entry().
Good trades !
Disclaimer (As it should always be one to any script)
***
This script is intended for and only to be used for personal purposes only. No such information provided by it constitutes advice or a recommendation for any investment or trading strategy for any specific person. There is no guarantee presented or implied as to the accuracy of specific forecasts, projections, or predictive statements offered by the script. Users of the script agree that its original developer does not take responsibility for any of your investment decisions. Please seek professional advice before trading.
***
# Here are the results from the 20rst of September 2021 with 100% of equity on the BTC /EUR 3 Min and with a capital of 10 000 EUR. So almost, one month.
# As I saw, it goes from +30% to more than +160% (the great SHIB) depending on the selected crypto. It may be negative if you spot a downtrend.

TradingGroundhog - Strategy & Wavetrend V2#-- Public Strategy - No Repaint - Fractals - Wavetrend --
Here I come with another script, a nice and simple strategy based on fractals and Wavetrends.
#-- Synopsis --
A simple idea, on a small time frame (15 min) we buy when the opening price goes below a Bottom fractals and sell when it goes over a Top fractals, but in order to avoid bad and evil downtrends, we use Wavetrends based on a Daily time frame. From it, Tops and Bottoms are extracted. If the opening price goes above Wavetrend Tops, no trades will be conducted during the day. If the price goes below Wavetrend bottoms, no trades will be executed from 1 to N days, until a new Wavetrend bottom is generated.
I developed the strategy using BTC /EUR 15 MIN BINANCE but it can be applied to many other cryptos, I don't know for forex or others. You can use it for long term and automated trading, I implemented the Wavetrend indicator to do so, or for short term if you have spot a long coming uptrend. Test it, look at its profit and long or short period on your crypto of choice.
#-- Graph reading --
And now, how to read it ?
Wavetrends:
Red Backgrounds are associated to No Trade periods. These periods occur when the price goes below a Wavetrend bottom or above a Wavetrend Top. They are here to limit the loss.
Blue Gradient lines represent the past Tops. For each bar, only the increasing values of the Wavetrend tops are acquired. Going from light to dark blue based on the age of the Tops. Thus, if on line goes from dark to light, this means the price is approaching a previous Wavetrend top. In the opposite, if it darken, thus the price say 'buy buy' and go dropping.
Yellow Gradient lines represent the past Bottoms. They are based on the same principe that the blue lines.
Fractals:
Yellow Flags occur when the opening price goes below a Bottom fractal , it means Buy.
White Flags appear when the opening price goes over a Top fractal , it means Sell.
#-- Parameters --
*** Parameters have been intensively optimized using 10 cryptocurrency markets in order to have potent efficiency for each of them. I would recommend to only change the Can Be touch parameter. For the others, I don't recommend any modifications. The idea behind the script is to be able to switch between markets without having to optimize parameters, less work, easy to target active crypto and therefor limit the risks. ***
Can be touch :
'Combined Smoothness' : The number of open individuals used by the Wavetrend. (6 or 9, often 9 is better but with less volatile crypto it will be 6)
'Filter fractals' : Activate or Disable the filtering fractal operation. If Enable, buy during less risky periods. (Disable is often better)
Can be touch but not necessary :
'VolumeMA' : The Volume corrector used by the fractals
'Extreme window' : The number of price individuals to look for if we want to remove extreme fractals.
Not to touch :
'Limit_candle to look on' : Number of candles to use to compute the Wavetrend Tops and Bottoms.
'Length top bottom drawn' : Size of the lines
'Long Sop Loss (%)' : The minimal difference of price between a Fractal bottom and the opening price to buy.
#-- Time frame --
Should be used with the following time frames depending on the necessity:
1 MIN
3 MIN (Interesting for short term profit, may need some parameter ajustements)
5 MIN
15 MIN (Preferred for long term profit, the script was developed on it)
#-- Last words --
The script can be set up to send Tradingview signals to 3comma just by adding comment = " " in strategy.close_all() and strategy.entry().
Good trades !
Disclaimer (As it should always be one to any script)
***
This script is intended for and only to be used for personal purposes only. No such information provided by it constitutes advice or a recommendation for any investment or trading strategy for any specific person. There is no guarantee presented or implied as to the accuracy of specific forecasts, projections, or predictive statements offered by the script. Users of the script agree that its original developer does not take responsibility for any of your investment decisions. Please seek professional advice before trading.
***
# Here are the results from the 1rst of July 2021 with 100% of equity on the BTC /EUR 15 Min and with a capital of 1 000 EUR.
# As I saw, it goes from +20% to more than +100% depending on the selected crypto. Sometimes it's negative but it's quite rare on crypto using the EUR.

Cava Signals Backtesting/VisualizerPLEASE READ THE DESCRIPTION CAREFULLY
Trying this again, as it seems I keep violating the rules unintentionally. Moderator, please forgive me as I try to make this right.
This backtesting/visualizer script was created for me to get a visual idea of the Cava Signals indicator throughout its development time and continuous optimization.
This script is to be used on the 30-minute timeframe on supported markets, and whether I can only publish strategies on regular candles, the indicator is meant to trigger on heikin ashi candles.I understand backtesting on non-regular candles produces unrealistic results, but I emphasize that this script is more for visualization purposes rather than accurate $ amounts from the trades. The signals are used along with a dedicated bot configuration, so part of the strategy is not managed by the script, but by the bot's config.
Some behind the scenes on what we are looking at:
a combination of ema and sma crosses on different time frames (5m, 15m, 30m, 60m and 90m) - we call this the wave trend
a combination of stochastic rsi on different time frames (10m, 30m)
a combination of schaff trend cycles on different time frames (5m, 20m and 30m)
a combination of money flow index on different time frames (10m and 30m)
volume information for each supported market/pair
and a couple of other info particular to each pair
With the above combination of data points, we try to optimize our strategy for an entry, for dca'ing down in case the coin goes down as well as dca'ing up to maximize profit when a coin is going up, take profit levels when we recognize a good time to do so, and of course, a closing level. I would like to emphasize the *visualization* purpose of this script in recognizing lows, highs, and market structure to identify the important levels to signal - this script is NOT to be used for accurate backtesting, but for an idea of the overall performance of when signals are triggered.
Let me try to explain the workflow and icons you see on the chart:
The colored circles on the bottom of the chart are all buy signals; each color corresponds to a particular buy signal, we have a combination of 9 possible situations that would trigger a buy signal. Some would trigger a buy signal only in combination with other buy signals or other indicators within the script. we also display a green upwards arrow below bars when a buy signal is triggered.
The colored arrows pointing down on the top of the chart are close signals. We have a combination of 5 closing criteria each color corresponds to one, just like the buy signals do. We only close a trade in profit. If not in profit, we will look to DCA down.
DCA signals are shown by the green flag above bars. they are signals to DCA up or down depending on the trade being negative or positive. DCA'ing up or down is also managed by the bot's configuration for limits on when to accept the signal.
Take Profit levels are shown by the green diamond above bars and work in conjunction with the bot's config on when to take the signal if at all and other take profit levels. Usually, when we hit the first take profit level we move our stop loss to entry via the bot's take profit safety feature. You can see this call with the close entry named TPS .
The black bars you may see on the chart is to illustrate when the market is extended based on a particular strategy. During this period we will not trigger a buy signal unless there is a huge spike in positive volume .
The green number below the bars is the total positive delta volume on the buy candles.
On the table on the right upper corner, we show some information on the market and performance of the backtesting - for visualization purposes only!
Currently, the script is tailored to work with the following markets/pairs:
Binance Spot: ADA, ALGO, ATOM, AVAX, BNB, BTC , DOT, ETH, LINK, LUNA, MATIC, SOL, VET, XRP, XTZ
Binance Futures: BTC , ETH, ADA, ALGO, ATOM, BNB, COMP, DOT, ENJ , LINK, OCEAN, OMG, SOL, VET, XMR, XRP, XTZ, AVAX, AAVE, DOGE, LTC, LUNA, MKR , NEAR, ONT, RUNE, SUSHI, LTC, XLM , COMP, ONT, THETA, FTM , EGLD , WAVES, ONE, HTN , CHZ , HOT, MANA, CRV , RVN, BAT, ANKR, 1INCH, ALICE, ATA , AXS , CHR , COTI, NKN , RAY, REN, SRM , SXP , TLM
ByBit Inverse Perpetual: BTCUSD , ETHUSD
ByBit Futures: AAVE, ADA, ALGO, AVAX, AXS , BNB, BTC , DOT, ETH, LINK, LTC, MATIC, SOL, SUSHI, UNI , XEM, XRP, XTZ
The chosen pairs are subject to change based on the best-performing assets we are constantly analyzing.
I hope this helps to understand the script, its purpose and ideas. I hope this satisfies the community rules - it was not my intention to break them - if there's anything on the above or the script that still violates the guidelines, please let me know and accept my apologies in advance.
If anyone would like to know more, let me know in the comment section.
Thank you!

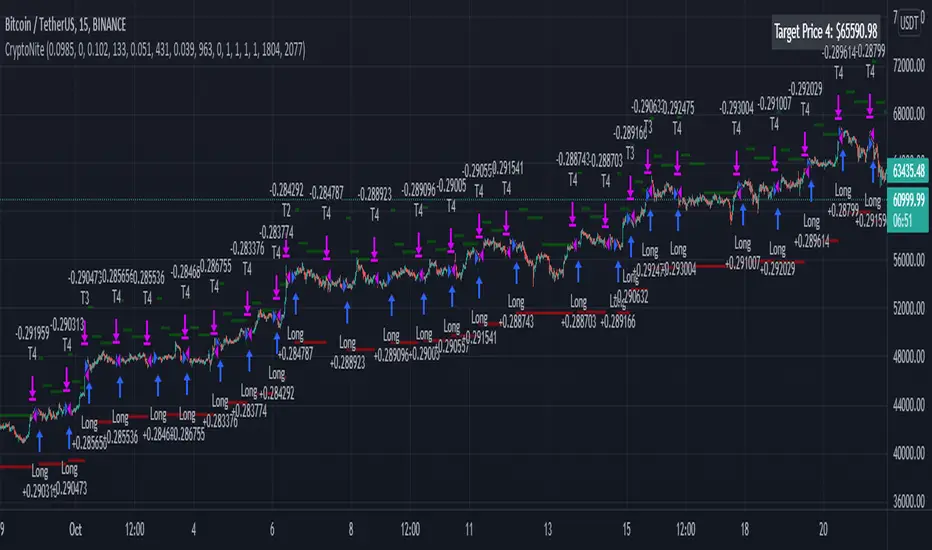
CryptoNite - Machine Learning Strategy (15Min Timeframe)Greeting Traders! I am back with another ML strategy. :D I kept my word with combining my machine learning algorithms from Python and integrating them into Tradingview. Thanks to Tradingview's new release of Pinescript v5 it is now possible. This strategy respects the Sortino Ratio and was created using 2 years of data for 50 different cryptocurrencies. That is a total of 100 years of data and 44,849 trades to create this strategy. Now let me tell you, my computer and I are exhausted. We both been at it non-stop for about two months everyday. I refine the strategy, and the computer runs 24/7 for a few days to spit out the best results into the terminal. It's been a good run so my computer will finally get some sleep tonight.
So let's talk a little about the features of the strategy. In the settings window, you'll see the Stoploss, Take Profit Parameters, and Date Range. You can change the Date Range, but I recommend to leave the SL/TP parameters how they are because the machine learning algo chose those input. If you wish to change them you are always welcome to do so but backtest results will change. For the Take Profit parameters you'll see on the left side you something labeled time duration(displayed in minutes) and on the right side you'll see take profit values. Let's talk a little bit how they work.
TP_values = {
"0": 0.102,
"133": 0.051,
"431": 0.039,
"963": 0
}
In python, the table looks like this but it is quite easy to understand in Tradingview.
From 0-133 minutes, the strategy is looking to the reach target point 1 at 10.2% profit.
From 133-431 minutes, the strategy is looking to the reach target point 2 at 5.1% profit.
From 431-963 minutes, the strategy is looking to the reach target point 3 at 3.9% profit.
From 963+ minutes, the strategy is looking to break even at 0% profit on target point 4.
Through each target point a sell trigger is active. It will look for the best time to sell even if TP has not been reached.
This helps the trade not stay open too long.
The last thing I need to mention is the textbox displayed on the right side of your chart. This textbox displays the current Take Profit value in dollar amount. So when you're in a trade you'll know what TP target has to be reached when the open trade is active. Throughout time, the target price changes depending how long the trade has been open. If you have any questions feel free to comment down below, and enjoy this strategy!
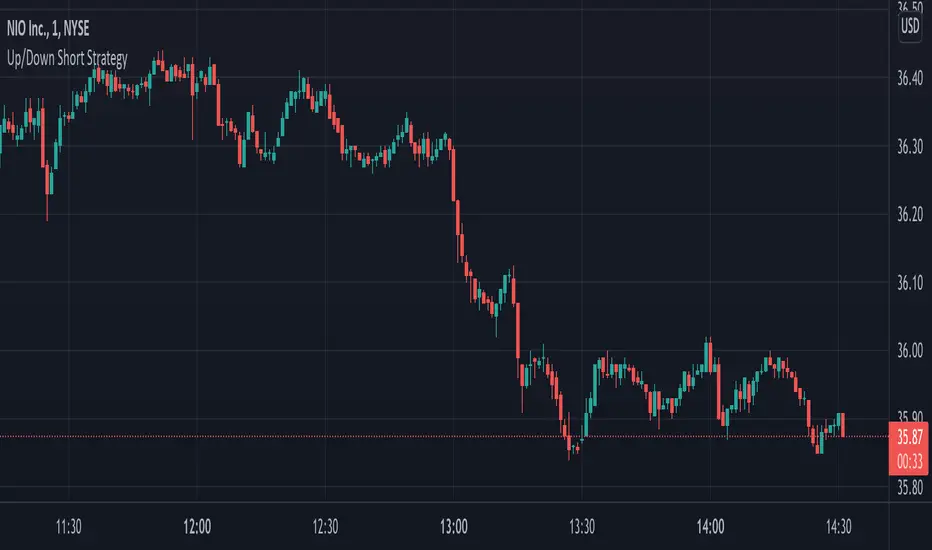
Up/Down Short StrategyThis is a consecutive bar up/down strategy for going short only where you can specify how many bars down to enter and how many bars up to exit. It also has code to check and make sure the condition is still true when launching the official alert, which helps back testing and live results line up, however be sure to enter commission and slippage into the properties to accurately reflect profits. I added back testing date ranges to this so you can easily pull up and see back tested results for a certain date range. I also added a buy and sell messages, close messages and take profit/stop loss message fields in the properties so you can launch alerts that will work with automated trading services. Simply enter your messages into those fields in the properties and then when you create an alert enter {{strategy.order.alert_message}} into the alert body and it will dynamically pull in your buy and sell messages when it fires alerts. I also added time restriction so you can enter trades only during the time frame specified. You can change it to any time frame, such at 0930-1600. Set the time restriction field to empty by default since otherwise the strategy won't take all trades like normal. So to enable time restriction enter a time frame in the format 0000-0000. I also added the ability to check off a box that will close the open trade at the end of the time restriction. So if you set the time frame to 0930-1600 and check off to enable close trade at end of time frame then it will look to exit the trade at the close of the next bar.
Price Change Scalping Strategy v1.0 - 3Commas EditionIntroduction
This strategy implements the Price Change Scalping (PCS) strategy specifically for the 3Commas platform. The Input settings have been redesigned to match the same inputs as the 3Commas My Bot Settings page. Only the "Deal Start Condition" section will echo the required PCS-related settings found in the original Price Change Scalping Strategy v1.0 to successfully implement the strategy.
The strategy uses a price rate of change (ROC) momentum calculation to determine the percent change in price between a defined range of bars. The calculated ROC value is then compared to the Upper Threshold and Lower Threshold values to determine if a trade setup is to be activated. If the threshold is crossed, a trade setup will occur based on the indicator settings. Entry, Take Profit, and Stop Loss prices are calculated and displayed on the chart. Once the Entry Price is crossed, a long or short position is created (depending on the direction) and once the Take Profit price is crossed, the position is closed. If the Entry Price is not crossed within a specific number of bars, the trade setup is canceled, and it will proceed to monitor price changes for the next set up.
How is it original and useful?
This strategy is unique in that the strategy version fully supports the TradingView backtester, which will enable you to perform experiments with various settings to evaluate performance using the historical chart data. The study version implements the "Start Deal" and "Close Deal" alerts for you to integrate with 3Comma's "Trading View Custom Signal" start condition. Both script versions will provide the same configuration abilities. The following list is a brief description of its usefulness:
Full support for all possible 3Commas bot settings.
Define a short or long trading strategy.
Price change data source and offset settings.
Your layering placement relative to the entry price.
Your trading parameters like take profit and stop loss offsets, trailing take profit support, exchange commission rates, trading start time, and order size multiplication for each layer.
Flexible trade eligibility rules that can use other chart indicators, like RSI or EMA, to exclude the selection of entry prices for trading.
The visibility of detailed statistics from the chart history pertaining to trading sessions started and closed, session durations, win rate, price action drops and bounces, as well as layer utilization.
The visibility of detailed Used Amount for Each Step table that details how each layer will be allocated for trading.
How does it compare to other scripts in the Public Library?
The strategy offers a very detailed, comprehensive settings to address all types of markets found on TradingView where you can implement the price change scalping strategy. The strategy version can be considered the first of its kind on TradingView to leverage the backtester to provide informative, detailed performance measurements surrounding this unique trading strategy. The study version will implement the latest alert framework called "Any Alert() Function" where you can create a single alert to handle multiple events, which include:
Deal Start
Deal Close
Strategy Results
The default settings are designed to define a "loose" price change settings to ensure that the indicator will render chart elements when first loaded as well as to allow the backtester to gather order executions and display performance summary. The strategy version is using $10,000 initial capital, a commission rate of 0.1% for both entries and exits, and a 1 tick slippage setting. It is also using 3.4881% of the equity for the Base Order Size, 4.7097% of equity for the first Safety Order Size. The Maximum Safety Trade Count is 7 with a Safety Order Volume Scale of 1.33, and a take profit of 2% with no stop loss. All other settings are defaults.
It is recommended that the indicator be "tuned" for your specific market to best implement the price change strategy and obtain better desirable results. You do so by scrolling through the chart's history and observing moments when prices tend to move rapidly. Measure the number or bars it typically takes for the price to change at a specific rate. Using this information, you can adjust the Price Change Settings accordingly to configure the indicator for the chart.
Always keep in mind that past performance may not be indicative of future results. Settings that seem favorable for one market may be found to be disastrous in another. Therefore, do take the time needed to understand how the settings will behave with the given chart symbol.
Enjoy! 😊👍
How to obtain access to the script?
You have two choices:
Use the "Website" link below to obtain access to this indicator, or
Send us a private message (PM) in TradingView itself.

Price Change Scalping Strategy v1.0Introduction
This strategy uses a price rate of change (ROC) momentum calculation to determine the percent change in price between a defined range of bars. The calculated ROC value is then compared to the Upper Threshold and Lower Threshold values to determine if a trade setup is to be activated. If the threshold is crossed, a trade setup will occur based on the indicator settings. Entry, Take Profit, and Stop Loss prices are calculated and displayed on the chart. Once the Entry Price is crossed, a long or short position is created (depending on the direction) and once the Take Profit price is crossed, the position is closed. If the Entry Price is not crossed within a specific number of bars, the trade setup is canceled, and it will proceed to monitor price changes for the next set up.
How is it original and useful?
This strategy is unique in that the strategy version fully supports the TradingView backtester, which will enable you to perform experiments with various settings to evaluate performance using the historical chart data. The study version implements numerous custom alerts for you to build TradingView notifications around specific price action events and stay informed with market activity in real-time. Both script versions will provide the same configuration abilities where you can define:
Define a short or long trading strategy.
Price change data source and offset settings.
Your layering placement relative to the entry price.
Your trading parameters like take profit and stop loss offsets, exchange commission rates, trading start time, and order size multiplication for each layer.
Flexible trade eligibility rules that can use other chart indicators, like RSI or EMA, to exclude the selection of entry prices for trading.
The visibility of detailed statistics from the chart history pertaining to trading sessions started and closed, session durations, win rate, price action drops and bounces, as well as layer utilization.
How does it compare to other scripts in the Public Library?
The strategy offers a very detailed, comprehensive settings to address all types of markets found on TradingView where you can implement the price change scalping strategy. The strategy version can be considered the first of its kind on TradingView to leverage the backtester to provide informative, detailed performance measurements surrounding this unique trading strategy. The study version will contain numerous custom alerts to aid in your notification preferences and stay informed on the indicator's activities:
Price Crossed Above Threshold
Price Crossed Below Threshold
Enter Long Position
Exit Long Position
Enter Short Position
Exit Short Position
Price Crossed DCA Layer 1 (Long)
Price Crossed DCA Layer 2 (Long)
Price Crossed DCA Layer 3 (Long)
Price Crossed DCA Layer 4 (Long)
Price Crossed DCA Layer 5 (Long)
Price Crossed DCA Layer 6 (Long)
Price Crossed DCA Layer 7 (Long)
Price Crossed DCA Layer 8 (Long)
Price Crossed DCA Layer 1 (Short)
Price Crossed DCA Layer 2 (Short)
Price Crossed DCA Layer 3 (Short)
Price Crossed DCA Layer 4 (Short)
Price Crossed DCA Layer 5 (Short)
Price Crossed DCA Layer 6 (Short)
Price Crossed DCA Layer 7 (Short)
Price Crossed DCA Layer 8 (Short)
Strategy Results
The default settings are designed to define a "loose" price change settings to ensure that the indicator will render chart elements when first loaded as well as to allow the backtester to gather order executions and display performance summary. The strategy version is using $10,000 initial capital, a commission rate of 0.1% for both entries and exits, and a 1 tick slippage setting. It is also using 2.74506% of the equity with a Order Size Multiplier of 1.33, using 8 total DCA layers, and a take profit of 2% with no stop loss. All other settings are defaults.
It is recommended that the indicator be "tuned" for your specific market in order to best implement the price change strategy and obtain better desirable results. You do so by scrolling through the chart's history and observing moments when prices tend to move rapidly. Measure the number or bars it typcially takes for the price to change at a specific rate. Using this information, you can adjust the Price Change Settings accordingly to configure the indicator for the chart.
Always keep in mind that past performance may not be indicative of future results. Settings that seem favorable for one market may be found to be disastrous in another. Therefore, do take the time needed to understand how the settings will behave with the given chart symbol.
Enjoy! 😊👍
How to obtain access to the script?
You have two choices:
Use the "Website" link below to obtain access to this indicator, or
Send us a private message (PM) in TradingView itself.

Quickfingers Luc's Base Breaking Strategy v2.5Introduction
The strategy attempts to implement a popular price action strategy by Luc Thomas (a.k.a. Quickfingers Luc) typically referred to as a QFL base-breaking strategy. The strategy revolves around price action movements that reveal “bases”, which are price levels of support that have a significant, rapid price surges called “bounces”. Once a base is revealed, the base price level is used as reference to implement multiple entries below the base using a layering technique of dollar-cost averaging to place multiple limit orders at various price levels below the base price. As price action breaks below the base price, the limit orders will be filled, and the take profit, breakeven and stop loss prices will be recalculated.
How is it original and useful?
This strategy is unique in that the strategy version fully supports the TradingView backtester, which will enable you to perform experiments with various settings to evaluate performance using the historical chart data. The study version implements numerous custom alerts for you to build TradingView notifications around specific price action events and stay informed with market activity in real-time. Both script versions will provide the same configuration abilities where you can define:
Base confirmation settings, including volume analysis.
Your preferred layering strategy of either Dollar-cost averaging (DCA) or grid-like layers along with precise layer placement.
Your trading parameters like take profit and stop loss offsets, exchange commission rates, trading start time, and position size multiplication for each layer.
Flexible trade eligibility rules that can use other chart indicators, like RSI or EMA, to exclude the selection of base prices for trading.
The visibility of detailed statistics from the chart history pertaining to trading sessions started and closed, session durations, win rate, price action drops and bounces, as well as layer utilization.
How does it compare to other scripts in the Public Library?
The strategy offers a very detailed, comprehensive settings to address all types of markets found on TradingView where you can implement the QFL base-breaking strategy. The strategy version can be considered the first of its kind on TradingView to leverage the backtester to provide informative, detailed performance measurements surrounding this unique trading strategy. The study version will contain numerous custom alerts to aid in your notification preferences and stay informed on the indicator's activities:
Base Created
Base Cracked
Base Respected
Any Layer Cracked
Layer 1 Cracked
Layer 2 Cracked
Layer 3 Cracked
Layer 4 Cracked
Layer 5 Cracked
Layer 6 Cracked
Layer 7 Cracked
Layer 8 Cracked
Layer 9 Cracked
Layer 1 Respected
Layer 2 Respected
Layer 3 Respected
Layer 4 Respected
Layer 5 Respected
Layer 6 Respected
Layer 7 Respected
Layer 8 Respected
Take Profit Crossed
Stop Loss Crossed
What does it do and how does it do it?
It is recommended that you start with a chart that is on an hourly timeframe with the "Scale Price Chart Only" chart setting enabled. When applied to the chart for the first time, the default settings will work to render base price levels in orange and 8 DCA layers in blue using a Fibonacci-like sequence for the deviation offset relative to the base price. As you scroll through the chart's history you should see price action crossing the DCA layers, denoted with blue triangles, and a green take-profit line will render with green triangle denoting the crossing. Lastly, when a trade session begins upon the crossing of the first layer, the indicator will continue to identify base price levels, but the color of the price lines will be gray. When the trade session concludes upon the crossing of the take profit line, the indicator will switch the most recent base price line from gray to orange to make it active and eligible for trading.
As price action develops, the indicator will use the "Base Confirmation Settings" to look back by counting the number of bars to the left and right of a pivot low point, measure the price drops and bounces, and volume amounts to validate that they are within the specified values. If so, the indicator will draw an orange triangle beneath the candle bar to denote it as the pivot low point and begin rendering the orange line as the base price. The DCA layers will be calculated and offset relative to the base price using thin blue lines.
Optionally, the breakeven price line will be drawn to help visualize the true breakeven price which takes into consideration the exchange fees being applied. Base line, take profit, stop loss and DCA layer crossings will be denoted with colorful shapes to help visually recognize the events on the chart.
The volume is validated only at the pivot low candle. It will measure the volume against the moving average to determine base confirmation. A volume factor of 1 will mean that the volume must be at least the same value as the moving average value. A volume factor of 2 means it must be twice the moving average value.
Lastly, the very last bar will render a table of statistics that summarize all the events that have taken place since the indicator began simulating trading sessions from the chart's history.
Strategy Results
The default settings are designed to define a "weak" QFL base to ensure that the indicator will render chart elements when first loaded as well as to allow the backtester to gather order executions and display performance summary. The strategy version is using $10,000 initial capital, a commission rate of 0.1% for both entries and exits, and a 1 tick slippage setting. It is also using 3.4887% of the equity with a Position Size Multiplier of 1.35, using 8 total DCA layers, and a take profit of 5% with no stop loss. All other settings are defaults.
It is recommended that the indicator be "tuned" for your specific market in order to best implement the QFL trading strategy and obtain better desirable results. You do so by using the statistics table and observe the Mean Price Drop and Bounce values to learn what the indicator is detecting when it measures from the pivot low points. Using this information, you can adjust the Base Confirmation Settings accordingly, along with any volume specifications you require, to configure the indicator for the chart.
Always keep in mind that past performance may not be indicative of future results. Settings that seem favorable for one market may be found to be disastrous in another. Therefore, do take the time needed to understand how the settings will behave with the given chart symbol.
Enjoy! 😊👍
How to obtain access to the script?
You have two choices:
Use the "Website" link below to obtain access to this indicator, or
Send us a private message (PM) in TradingView itself.

Combo Backtest 123 Reversal & T3 Averages This is combo strategies for get a cumulative signal.
First strategy
This System was created from the Book "How I Tripled My Money In The
Futures Market" by Ulf Jensen, Page 183. This is reverse type of strategies.
The strategy buys at market, if close price is higher than the previous close
during 2 days and the meaning of 9-days Stochastic Slow Oscillator is lower than 50.
The strategy sells at market, if close price is lower than the previous close price
during 2 days and the meaning of 9-days Stochastic Fast Oscillator is higher than 50.
Second strategy
This indicator plots the moving average described in the January, 1998 issue
of S&C, p.57, "Smoothing Techniques for More Accurate Signals", by Tim Tillson.
This indicator plots T3 moving average presented in Figure 4 in the article.
T3 indicator is a moving average which is calculated according to formula:
T3(n) = GD(GD(GD(n))),
where GD - generalized DEMA (Double EMA) and calculating according to this:
GD(n,v) = EMA(n) * (1+v)-EMA(EMA(n)) * v,
where "v" is volume factor, which determines how hot the moving average’s response
to linear trends will be. The author advises to use v=0.7.
When v = 0, GD = EMA, and when v = 1, GD = DEMA. In between, GD is a less aggressive
version of DEMA. By using a value for v less than1, trader cure the multiple DEMA
overshoot problem but at the cost of accepting some additional phase delay.
In filter theory terminology, T3 is a six-pole nonlinear Kalman filter. Kalman
filters are ones that use the error — in this case, (time series - EMA(n)) —
to correct themselves. In the realm of technical analysis, these are called adaptive
moving averages; they track the time series more aggres-sively when it is making large
moves. Tim Tillson is a software project manager at Hewlett-Packard, with degrees in
mathematics and computer science. He has privately traded options and equities for 15 years.
WARNING:
- For purpose educate only
- This script to change bars colors.
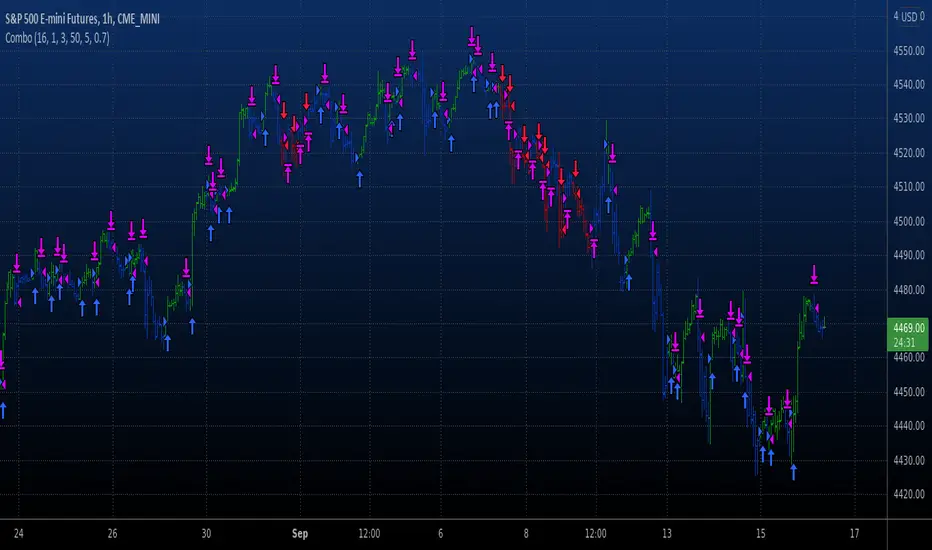
Combo Backtest 123 Reversal & Stochastic Crossover This is combo strategies for get a cumulative signal.
First strategy
This System was created from the Book "How I Tripled My Money In The
Futures Market" by Ulf Jensen, Page 183. This is reverse type of strategies.
The strategy buys at market, if close price is higher than the previous close
during 2 days and the meaning of 9-days Stochastic Slow Oscillator is lower than 50.
The strategy sells at market, if close price is lower than the previous close price
during 2 days and the meaning of 9-days Stochastic Fast Oscillator is higher than 50.
Second strategy
This back testing strategy generates a long trade at the Open of the following
bar when the %K line crosses below the %D line and both are above the Overbought level.
It generates a short trade at the Open of the following bar when the %K line
crosses above the %D line and both values are below the Oversold level.
WARNING:
- For purpose educate only
- This script to change bars colors.

Bollinger Bands And Aroon Scalping (by Coinrule)Many technical indicators can be profitable in certain market conditions while failing in others. No indicator is perfect alone.
All the best trading strategies involve multiple indicators and leverage the benefit of each of them. The following is an optimised strategy based on Bollinger Bands and the Aroon indicator.
The Bollinger Bands are among the most famous and widely used indicators. They can suggest when an asset is oversold or overbought in the short term, thus provide the best time for buying and selling it.
A strategy buying dips can work well during times of uptrend. Downtrends will result in a drawdown for the P&L of the strategy. The suggested approach minimises the drawdowns, ensuring that the system trades only when it's more likely to close the trade in profit.
The Setup
ENTRY
The price crosses below the basis line of the Bollinger Band indicator
The Aroon Indicator is above 90
EXIT
The price crosses below the upper Bollinger Band
The Aroon Indicator drops below 70
The Aroon Indicator plays a key role in this strategy. It acts as a confirmation that the asset is currently in an uptrend. On the other hand, it acts as a stop if market conditions deteriorate. The strategy uses an Aroon Indicator set to 288 periods to provide a longer-term view on market conditions, not being heavily dependent on short-term volatility.
The best time frame for this strategy based on our backtest is the 4-hr . The 1-hr can work well with three times more trades, on average. As trades increase, the profitability decreases. Yet again, this is the confirmation that trading more does not mean gaining more.
To make the results more realistic, the strategy assumes each order to trade 30% of the available capital. A trading fee of 0.1% is taken into account. The fee is aligned to the base fee applied on Binance, which is the largest cryptocurrency exchange.

OnePunch Algo Momentum Indicator V1This is another Plugin from One Punch Algo Team. We call it OnePunch Algo Momentum Indicator V1.
Basic Use:
One Punch Algo Momentum Indicator plugin is used for momentum stocks and high volatility crypto. It provide signals based on Simple Moving Average, Volume, Support & Resistance Lines.
SIGNALS/ALERTS
Buy Signal: Purple Color uptrend icon gives you a signal of an up-trending movement or we call it momentum movement. This signal basically happen when a stock land in a high volatility zone. We use in-build systems such as SMA, Support and Resistance and Trends to come up with the Buy Signal.
Sell Signal: Gray Color downtrend icon gives you a signal of a downtrend movement.
Other Lines Shown in the Diagram:
Red Line is the 200 Day Simple Moving Average (SMA)
Green Line is the 50 Day Simple Moving Average (SMA)
Strategy Tester
Always make sure to use the strategy tester to test how historically our Algo has performed in different time frames. One Punch Algo Momentum Indicator provide the ability to backtest based on certain time periods. This allows you to backtest our Algo vs some other Algo to find which performed well for the given time period, you if you want to see buy and hold performance better than the use of an Algo. This is a strong tool to use for your analysis of a stock or crypto.
What are the timeframes where it is most effective?
Different Stocks or Crypto perform differently with One Punch Algo Momentum Indicator. Please make sure to backtest a stock or crypto before you use the strategy.
Short Term/Day Trading Setup
For Short Term or Day Trade: 1min, 5min, 15min & 30min candlesticks works really well.
Also 3min, 5min, 7min and 15min works as well
Mid Term Trading Setup
For Mid-term traders: 30min, 1hr,2hr, and 4hr setup works really well.
For Long Term Trading Setup
For long term traders: 4hr, 1D, 1Week and 1Month Setup works well.
Best used with Heikin Ashi or Candlestick charts.
DISCLAIMER: Stocks and options trading involves substantial RISK of LOSS and is NOT suitable for every investor. The valuation of stocks and options may fluctuate, and, as a result, clients may lose more than their original investment. If the market moves against you, you may sustain a total loss greater than the amount you deposited into your account. You are responsible for all the risks and financial resources you use and for the chosen trading system. You should not engage in trading unless you fully understand the nature of the transactions you are entering into and the extent of your exposure to loss. If you do not fully understand these risks, you must seek independent advice from your financial advisor.
All trading strategies are used at your own risk. And OnePunch ALGO Developer, Youtuber or the channel does NOT take any responsibility for your losses using any of the advice or suggestions or strategies are shown/said in any of OnePunch ALGO Youtuber or the channel videos.
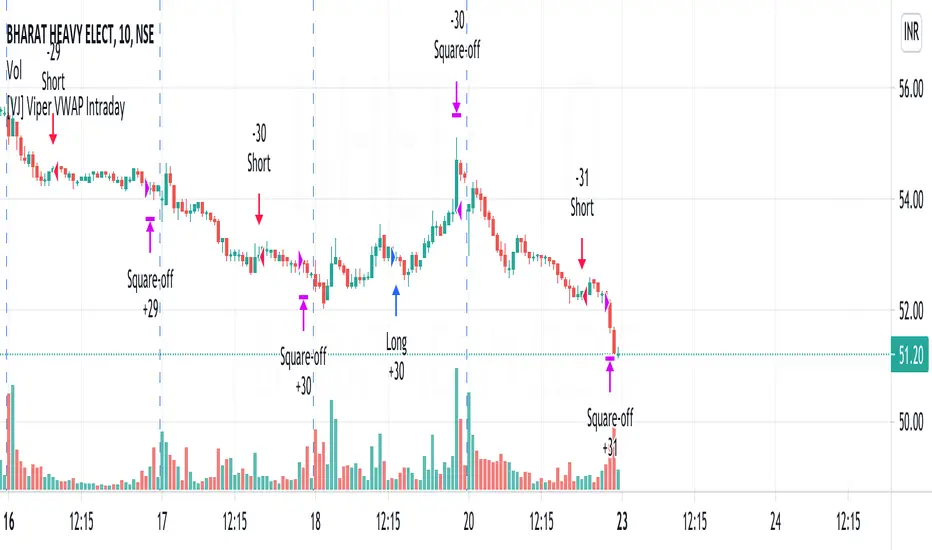
[VJ] Viper VWAP IntradayHello Traders, this is a simple intraday strategy involving the ever reliable VWAP and a chop index to add twist to the traditional style . You can modify the values on the stock and see what are your best picks. Comment below if you found something with good returns
Strategy: VWAP based strategy but uses an additional powerful indicator Chop index to help us stay out of false trades.
Indicators used :
VWAP identifies the true average price of a stock by factoring the volume of transactions at a specific price point and not based on the closing price. VWAP can add more value than your standard 10, 50, or 200 moving average indicators because VWAP reacts to price movements based on the volume during a given period.
The Choppiness Index is designed to determine whether the market is choppy or trading sideways, or not choppy and trading within a trend in either direction. Using a scale from 1 - 100, the market is considered to be choppy as values near 100 (over 61.80) and trending when values are lower than 38.20)
Buying/Selling typically happens at VWAP Breakouts which is then validated with extreme CI to ascertain the entries
Aggressive trade stop can be employed by using the % for long and shorts in the strategy.
Usage & Best setting :
Choose a good volatile stock and a time frame - 10m.
CI Index : 14
Trend Factor - anything below 38.2 is considered in trend, you can experiment from 50
There is stop loss and take profit that can be used to optimise your trade
The template also includes daily square off based on your time.
QuickSilver Intraday using RSIThis is a simple intraday strategy using very basic intraday super indicators - RSI & VWAP for working on Stocks . You can modify the values on the stock and see what are your best picks. Comment below if you found something with good returns
Strategy:
Indicators used :
The Relative Strength Index (RSI) is one of the most popular and widely used momentum oscillators.The values of the RSI oscillator, typically measured over a 14-day period, fluctuate between zero and 100. The Relative Strength Index indicates oversold market conditions when below 30 and overbought market conditions when above 70
VWAP identifies the true average price of a stock by factoring the volume of transactions at a specific price point and not based on the closing price. VWAP can add more value than your standard 10, 50, or 200 moving average indicators because VWAP reacts to price movements based on the volume during a given period.
Buying happens at VWAP Breakouts which is then validated with RSI to check for overbought & oversold conditions.
Aggressive trade stop can be employed by using the % for long and shorts in the strategy.
Usage & Best setting :
Choose a good volatile stock and a time frame - 10m.
RSI : 9
Overbought & Oversold - can be varied as per user
There is stop loss and take profit that can be used to optimise your trade
Extending this to,
In general guidelines for RSI :
Short-term intraday traders (day trading) often use lower settings with periods in the range of 9-11.
Medium-term swing traders frequently use the default period setting of 14.
Longer-term position traders often set it at a higher period, in the range of 20-30.
The template also includes daily square off based on your time.

Combo Backtest 123 Reversal & RSIThis is combo strategies for get a cumulative signal.
First strategy
This System was created from the Book "How I Tripled My Money In The
Futures Market" by Ulf Jensen, Page 183. This is reverse type of strategies.
The strategy buys at market, if close price is higher than the previous close
during 2 days and the meaning of 9-days Stochastic Slow Oscillator is lower than 50.
The strategy sells at market, if close price is lower than the previous close price
during 2 days and the meaning of 9-days Stochastic Fast Oscillator is higher than 50.
Second strategy
The RSI is a very popular indicator that follows price activity.
It calculates an average of the positive net changes, and an average
of the negative net changes in the most recent bars, and it determines
the ratio between these averages. The result is expressed as a number
between 0 and 100. Commonly it is said that if the RSI has a low value,
for example 30 or under, the symbol is oversold. And if the RSI has a
high value, 70 for example, the symbol is overbought.
WARNING:
- For purpose educate only
- This script to change bars colors.

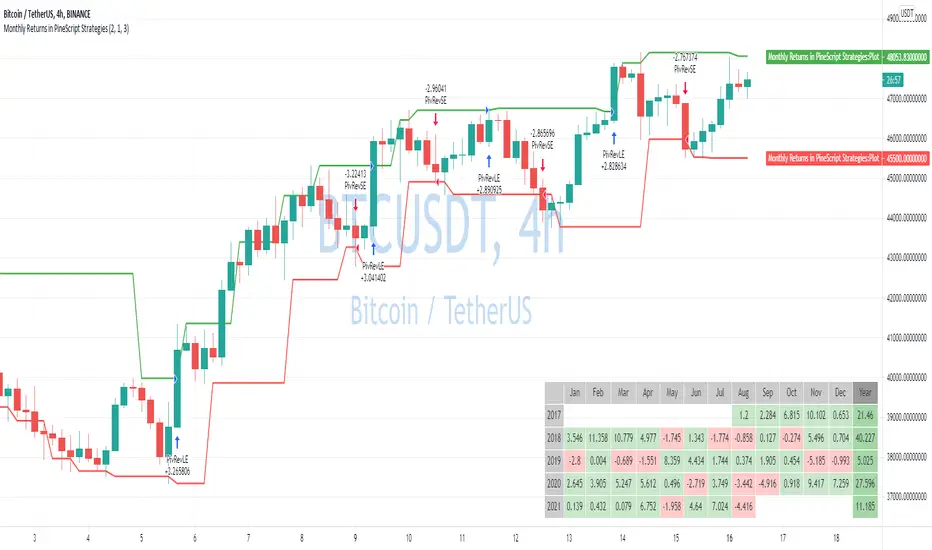
Monthly Returns in PineScript StrategiesI'm not 100% satisfied with the strategy performance output I receive from TradingView. Quite often I want to see something that is not available by default. I usually export raw trades/metrics from TradingView and then do additional analysis manually.
But with tables, you can build additional metrics and tools for your strategies quite easily.
This script will just show a table with monthly/yearly performance of your script. Quite a lot of traders/investors used to look at returns like that. Also, it might help you to identify periods of time when your strategy performed good/bad than expected and try to analyze that better.
The script is very simple and I believe you can easily apply it to your own strategies.
Disclaimer
Please remember that past performance may not be indicative of future results.
Due to various factors, including changing market conditions, the strategy may no longer perform as well as in historical backtesting.
This post and the script don’t provide any financial advice.
Combo Backtest 123 Reversal & Awesome Oscillator (AO) This is combo strategies for get a cumulative signal.
First strategy
This System was created from the Book "How I Tripled My Money In The
Futures Market" by Ulf Jensen, Page 183. This is reverse type of strategies.
The strategy buys at market, if close price is higher than the previous close
during 2 days and the meaning of 9-days Stochastic Slow Oscillator is lower than 50.
The strategy sells at market, if close price is lower than the previous close price
during 2 days and the meaning of 9-days Stochastic Fast Oscillator is higher than 50.
Second strategy
This indicator is based on Bill Williams` recommendations from his book
"New Trading Dimensions". We recommend this book to you as most useful reading.
The wisdom, technical expertise, and skillful teaching style of Williams make
it a truly revolutionary-level source. A must-have new book for stock and
commodity traders.
The 1st 2 chapters are somewhat of ramble where the author describes the
"metaphysics" of trading. Still some good ideas are offered. The book references
chaos theory, and leaves it up to the reader to believe whether "supercomputers"
were used in formulating the various trading methods (the author wants to come across
as an applied mathemetician, but he sure looks like a stock trader). There isn't any
obvious connection with Chaos Theory - despite of the weak link between the title and
content, the trading methodologies do work. Most readers think the author's systems to
be a perfect filter and trigger for a short term trading system. He states a goal of
10%/month, but when these filters & axioms are correctly combined with a good momentum
system, much more is a probable result.
There's better written & more informative books out there for less money, but this author
does have the "Holy Grail" of stock trading. A set of filters, axioms, and methods which are
the "missing link" for any trading system which is based upon conventional indicators.
This indicator plots the oscillator as a histogram where periods fit for buying are marked
as blue, and periods fit for selling as red. If the current value of AC (Awesome Oscillator)
is over the previous, the period is deemed fit for buying and the indicator is marked blue.
If the AC values is not over the previous, the period is deemed fir for selling and the indicator
is marked red.
WARNING:
- For purpose educate only
- This script to change bars colors.
Combo Backtest 123 Reversal & Awesome Oscillator (AC) This is combo strategies for get a cumulative signal.
First strategy
This System was created from the Book "How I Tripled My Money In The
Futures Market" by Ulf Jensen, Page 183. This is reverse type of strategies.
The strategy buys at market, if close price is higher than the previous close
during 2 days and the meaning of 9-days Stochastic Slow Oscillator is lower than 50.
The strategy sells at market, if close price is lower than the previous close price
during 2 days and the meaning of 9-days Stochastic Fast Oscillator is higher than 50.
Second strategy
This indicator plots the oscillator as a histogram where blue denotes
periods suited for buying and red . for selling. If the current value
of AO (Awesome Oscillator) is above previous, the period is considered
suited for buying and the period is marked blue. If the AO value is not
above previous, the period is considered suited for selling and the
indicator marks it as red.
WARNING:
- For purpose educate only
- This script to change bars colors.
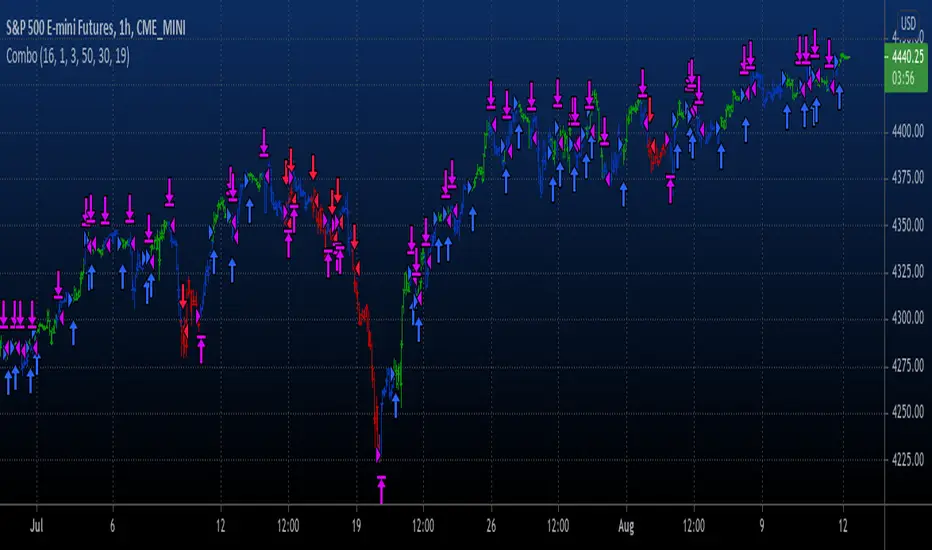
Random Entries Work!" tHe MaRkEtS aRe RaNdOm ", say moron academics.
The purpose of this study is to show that most markets are NOT random! Most markets show a clear bias where we can make such easy money, that a random number generator can do it.
=== HOW THE INDICATOR WORKS ===
The study will randomly enter the market
The study will randomly exit the market if in a trade
You can choose a Long Only, Short Only, or Bidirectional strategy
=== DEFAULT VALUES AND THEIR LOGIC ===
Percent Chance to Enter Per Bar: 10%
Percent Chance to Exit Per Bar: 3%
Direction: Long Only
Commission: 0
Each bar has a 10% chance to enter the market. Each bar has a 3% to exit the market . It will only enter long.
I included zero commission for simplification. It's a good exercise to include a commission/slippage to see just how much trading fees take from you.
=== TIPS ===
Increasing "Percent Chance to Exit" will shorten the time in a trade. You can see the "Avg # Bars In Trade" go down as you increase. If "Percent Chance to Exit" is too high, the study won't be in the market long enough to catch any movement, possibly exiting on the same bar most of the time.
If you're getting the red screen, that means the strategy lost so much money it went broke. Try reducing the percent equity on the Properties tab.
Switch the start year to avoid/minimize black swan events like the covid drop in 2020.
=== FINDINGS ===
Most markets lose money with a "Random" direction strategy.
Most markets lose ALL money with a "Short Only" strategy.
Most markets make money with a "Long Only" strategy.
Try this strategy on: Bitcoin (BTCUSD) and the NASDAQ (QQQ).
There are two popular memes right now: "Bitcoin to the moon" and "Stocks only go up". Both are seemingly true. Bitcoin was the best performing asset of the 2010's, gaining several billion percent in gains. The stock market is on a 100 year long uptrend. Why? BECAUSE FIAT CURRENCIES ALWAYS GO DOWN! This is inflation. If we measure the market in terms of others assets instead of fiat, the Long Only strategy doesn't work anymore (or works less well).
Try this strategy on: Bitcoin/GLD (BTCUSD/GLD), the Eurodollar (EURUSD), and the S&P 500 measured in gold (SPY/GLD).
Bitcoin measured in gold (BTCUSD/GLD) still works with a Long Only strategy because Bitcoin increased in value over both USD and gold.
The Eurodollar (EURUSD) generally loses money no matter what, especially if you add any commission. This makes sense as they are both fiat currencies with similar inflation schedules.
Gold and the S&P 500 have gained roughly the same amount since ~2000. Some years will show better results for a long strategy, while others will favor a short strategy. Now look at just SPY or GLD (which are both measured in USD by default!) and you'll see the same trend again: a Long Only strategy crushes even when entering and exiting randomly.
=== " JUST TELL ME WHAT TO DO, YOU NERD! " ===
Bulls always win and Bears always lose because fiat currencies go to zero.
You're not underperforming a random number generator, are you?

Combo Backtest 123 Reversal & 2/20 Exponential MA This is combo strategies for get a cumulative signal.
First strategy
This System was created from the Book "How I Tripled My Money In The
Futures Market" by Ulf Jensen, Page 183. This is reverse type of strategies.
The strategy buys at market, if close price is higher than the previous close
during 2 days and the meaning of 9-days Stochastic Slow Oscillator is lower than 50.
The strategy sells at market, if close price is lower than the previous close price
during 2 days and the meaning of 9-days Stochastic Fast Oscillator is higher than 50.
Second strategy
This indicator plots 2/20 exponential moving average. For the Mov
Avg X 2/20 Indicator, the EMA bar will be painted when the Alert criteria is met.
WARNING:
- For purpose educate only
- This script to change bars colors.
